Rebuilding a Million-Dollar Ecommerce Company: 4-Year Update

Every year since 2017, I've chronicled rebuilding a 7-figure brand from absolute scratch after the sale of my previous company. That goal has been achieved (see the 18-month update), but I continue to give a yearly update on the performance of the brand.
In this article, I will give a four-year update (I can't believe it has been that long!) which will detail revenues, wins, losses, and goals for the next year.
We have an episode about this subject on the podcast. If you'd like to listen, you can find the episode by clicking here.
Related Reading: Rebuilding a Million Dollar Ecommerce Company, 36 Month Update
Related Reading: Rebuilding a Million Dollar Ecommerce Company, 24 Month Update
Related Reading: Rebuilding a Million Dollar Ecommerce Company, 18 Month Update
Related Reading: Rebuilding a Million Dollar Ecommerce Company, 12 Month Update
Related Reading: Rebuilding a Million Dollar Ecommerce Company, 6 month Update
Related Reading: Rebuilding a Million Dollar Ecommerce Company, 60 Day Update
Revenue Update
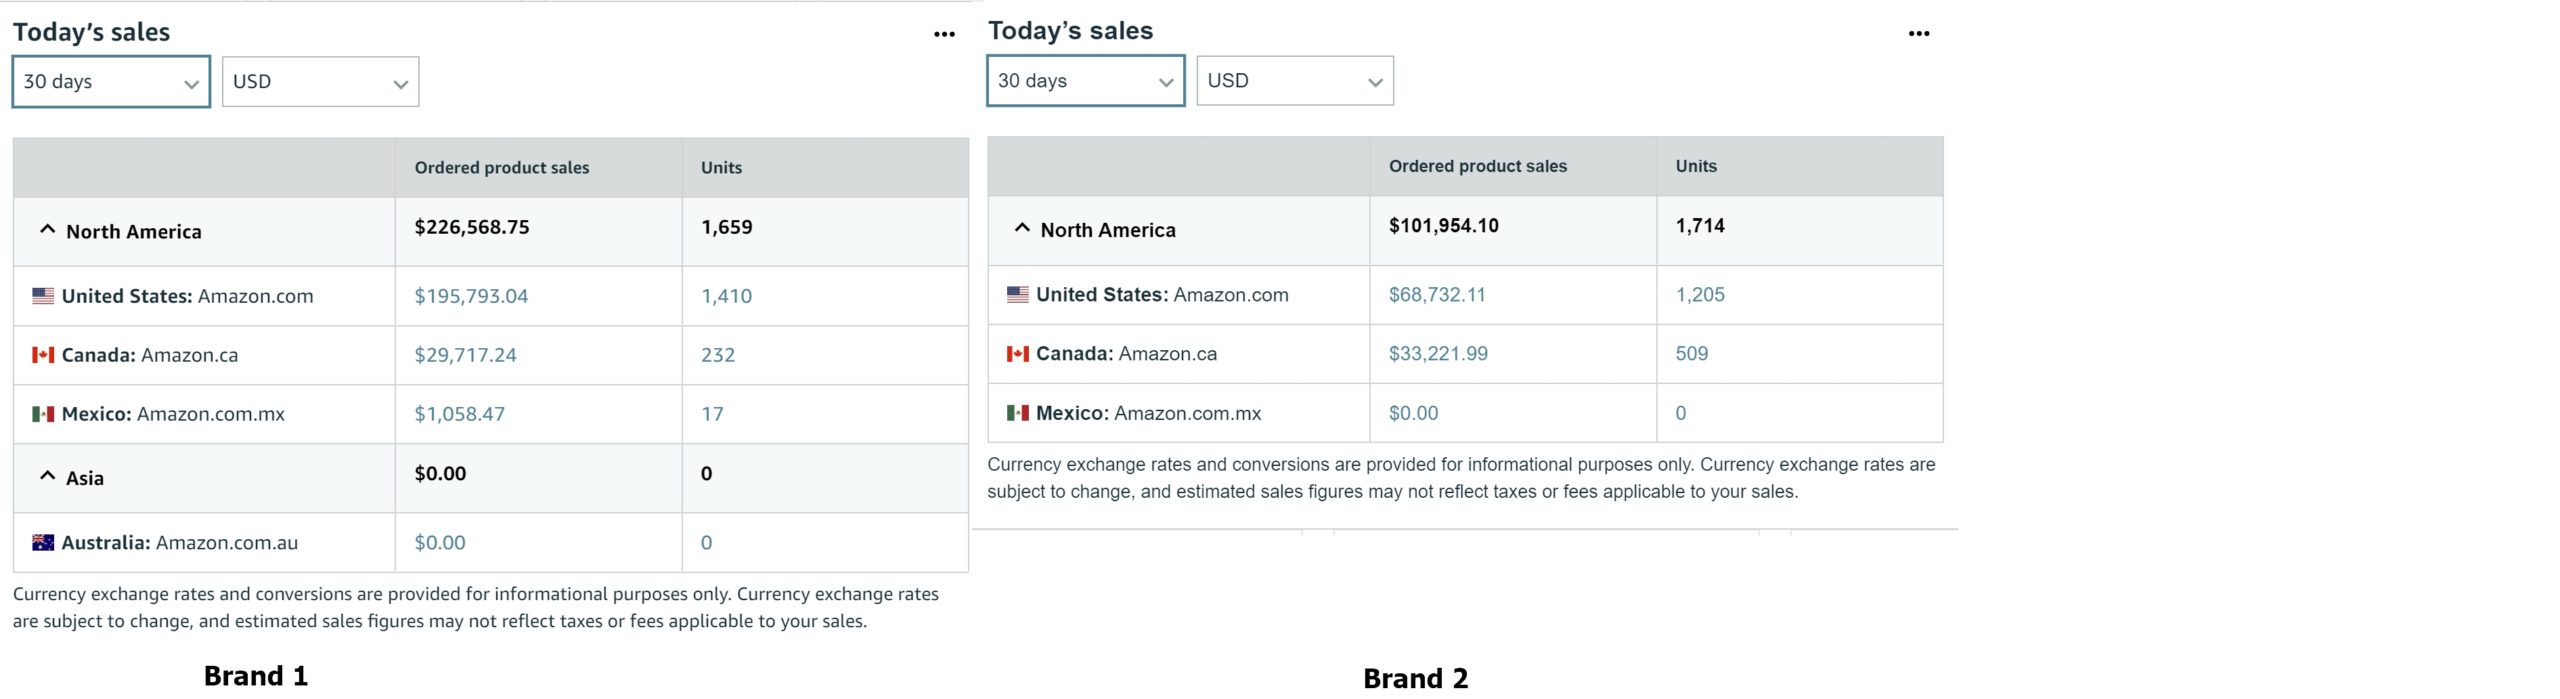
After three full years since starting my brand, revenues were just over $350,000 for June 2021 (which is actually May 10 to June 10 because of the way the reporting worked). This is about 76% greater than the same period in 2020.
| July 2017 | April 2018 | July 2019 | June 2020 | June 2021 | |
| Amazon.com | $10,788 | $32,237 | $76,710 | $155,957 | $283,758 |
| Amazon.ca | $1,180 | $12,145 | $21,700 | $41,405 | $63,283 |
| Amazon.com.mx | $1,180 | $12,145 | $21,700 | $41,405 | $1058 |
| eBay.com | $994 | $554 | $0 | $1,074 | $2,363 |
| Shopify | $552 | $629 | $2,469 | $4,230 | $6,327 |
| Total | $13,514 | $45,565 | $100,879 | $202,666 | $356,789 |
I often put June 2017 as month zero for this brand as this was when inventory finally got into Amazon warehouses and available for sale (of course, I had spent a ton of time before this, working on developing and sourcing the first products).
I now have approximately 35 products (up from roughly 20 last year), and each has around two variations (so there are roughly 70 individual SKUs overall).
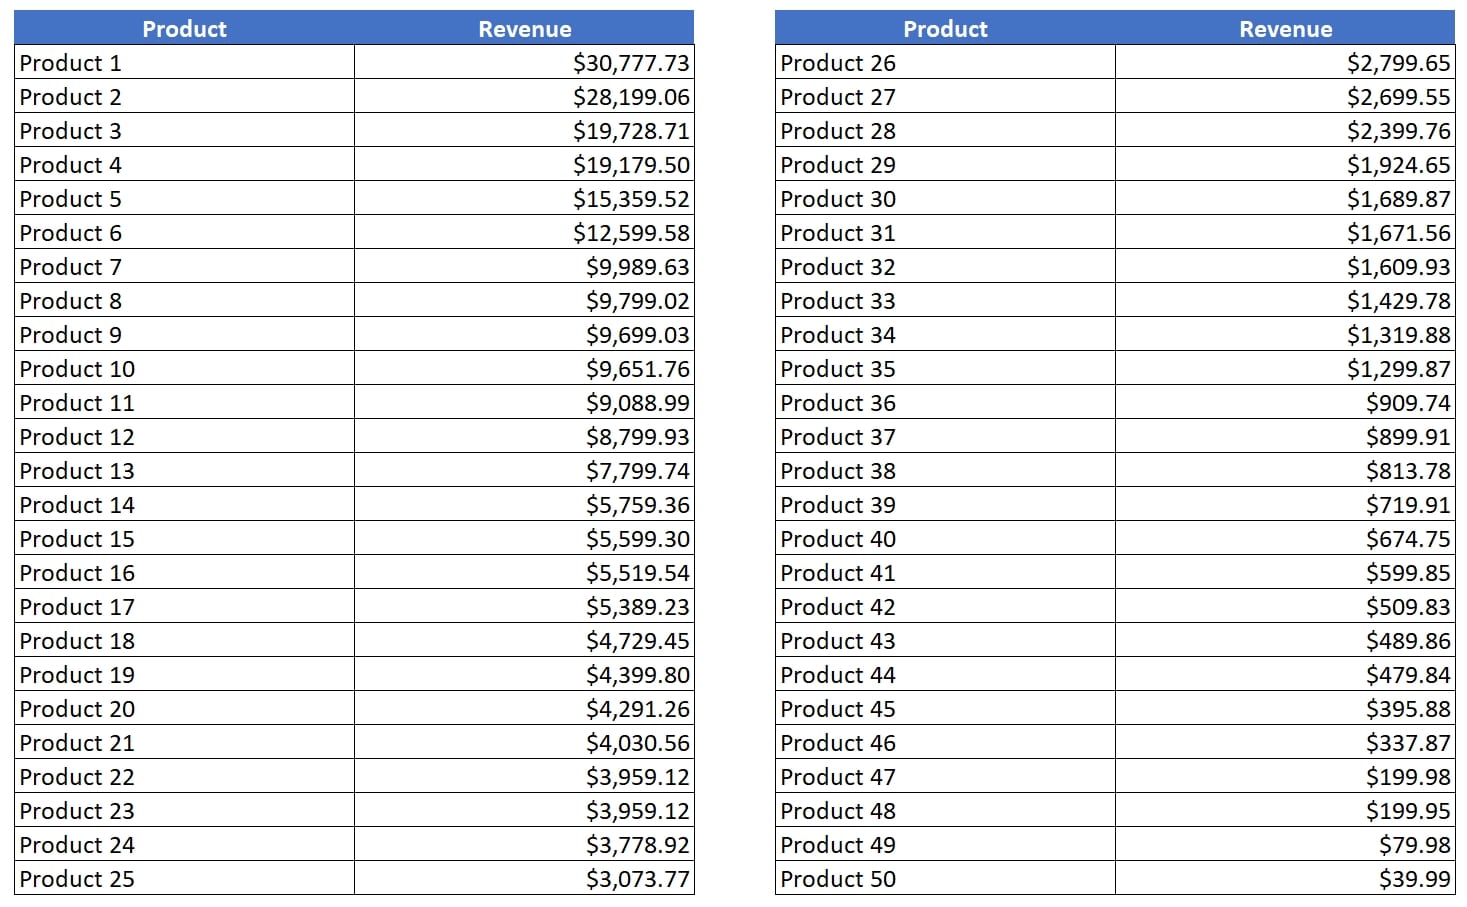
Overall, 18 individual SKUs (out of 70) make up 80% of my revenue.
Blog Traffic
Followers of this blog know that content and blog traffic have been a big part of our product launch strategy. Traffic was up about 50% year-over-year until a Google update resulted in a 25% traffic dip in early June.
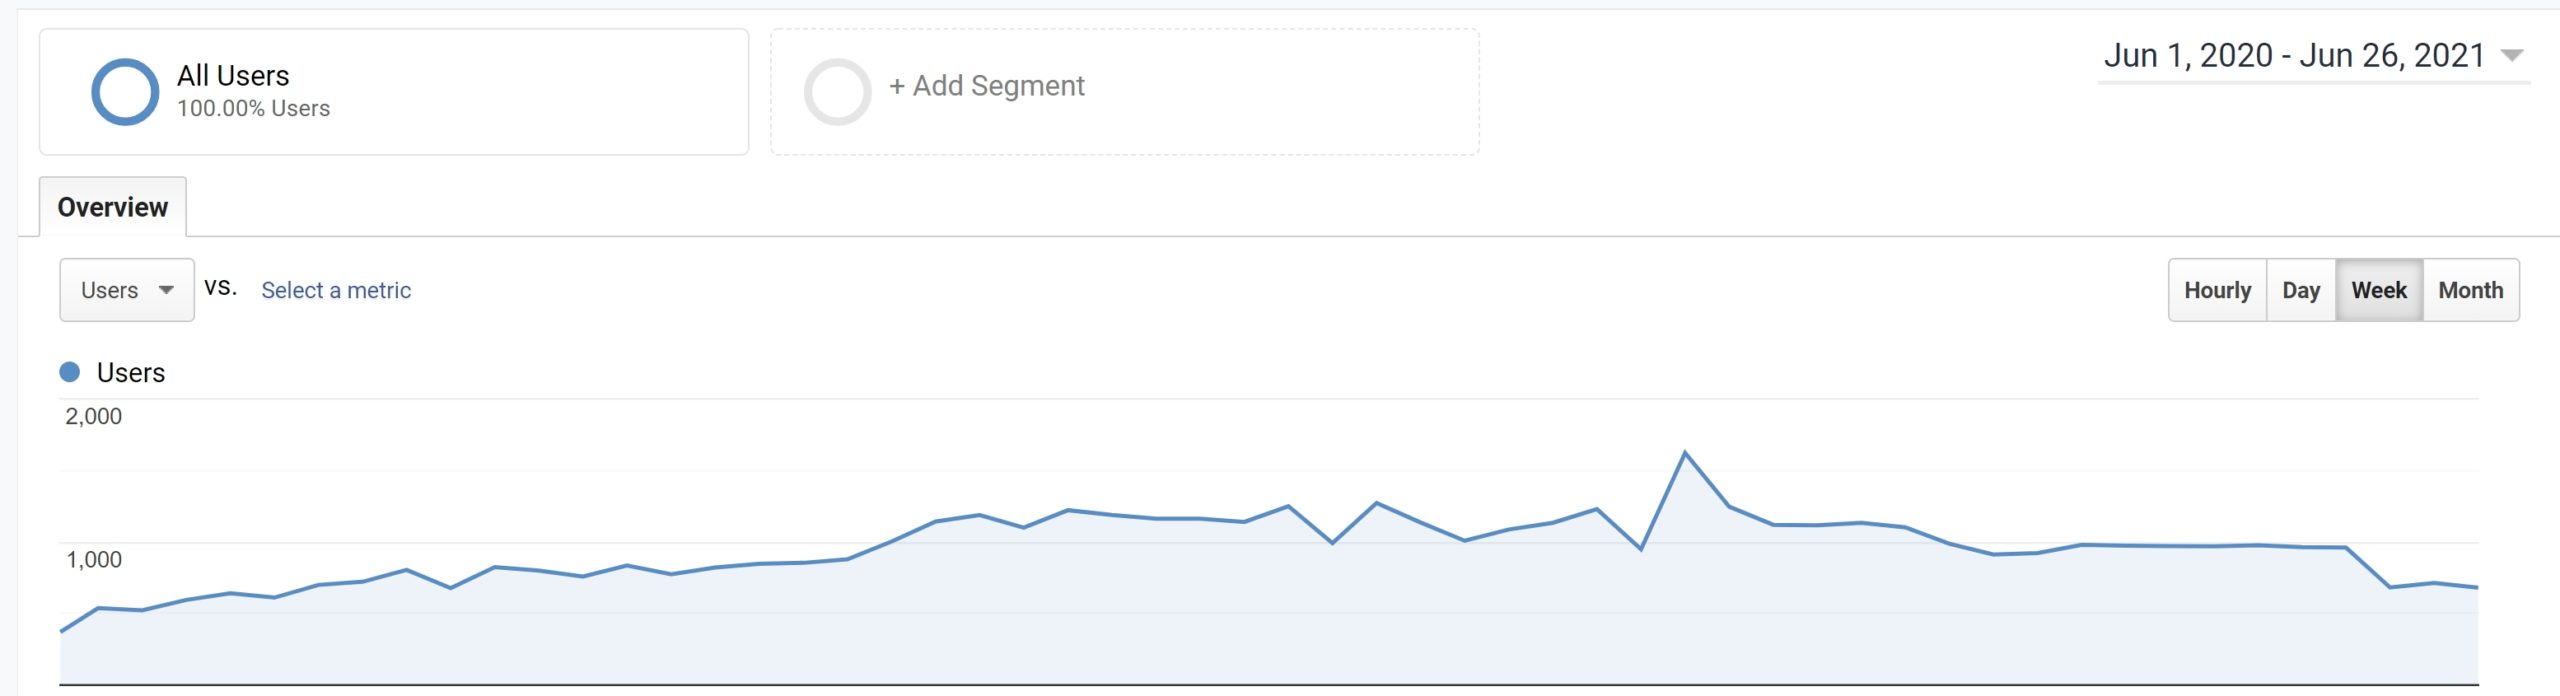
Almost all of our sites have seen a similar hit from this Google update (including EcomCrew). We've done zero black hat techniques for any of these sites, so my strong suspicion is that we'll recover from our traffic dip quite quickly.
Wins and Losses
For each annual update, I like to document some of my wins and losses for the year.
Wins
- Second Brand Saw Big Growth. Last year, I launched a second brand (and second Amazon account). Growth for this account was nearly 100% year-over-year. Most of the products here were basic private label products with some small degree of bundling.
- Two original product launches finally launched and were hits (with a caveat). I had spent nearly 18 months developing two new and original products that finally launched in 2021. One of the products is now also patent pending. I had also devoted nearly $75,000 to these product purchases (plus $10,000+ in development costs). Both of these products have been big hits and we've just re-ordered both of them. However, there is one caveat to one of these products (see below).
- Increased product prices by 25% to 35%. With rising sea freight costs and rising PPC costs, I knew we had to raise prices to at least keep pace with last year. Fortunately, our products have pretty good price elasticity during the summer months, and we were able to raise product prices by about 25% to 35%. If duties and sea freight costs ever come down, this would be an even bigger win going forward.
- Design patent for one of our products. I'm usually not a fan of getting design patents for products, but we launched an accessory for the bed of a pickup truck that can really only be designed in one way, meaning a design patent in this case actually made a lot of sense. I paid about $5000 for this. The product has been a great success and should be a $250,000 to $500,000 product that will hopefully be defensible for the life of the patent.
Losses
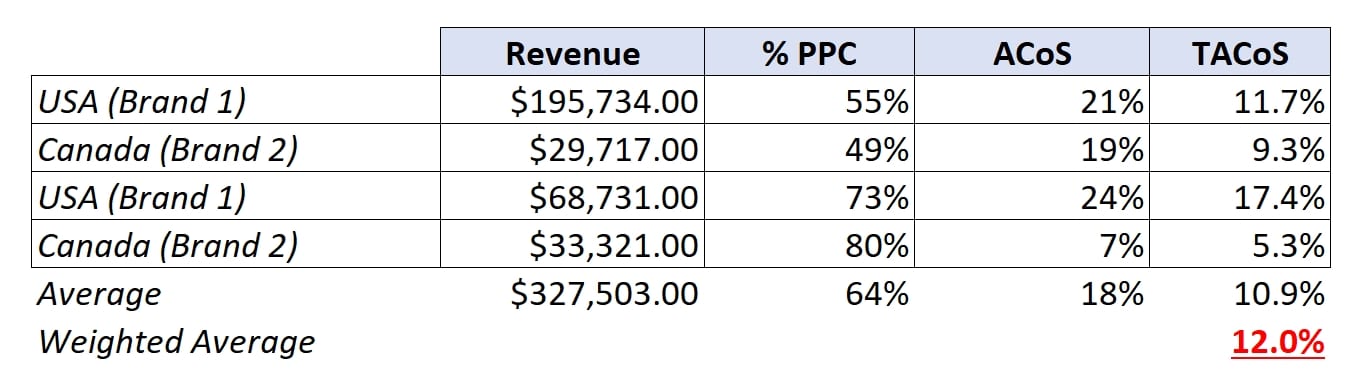
PPC costs continuing to rise. This is one of the biggest threats that the business faces right now. Total ACoS continues to rise, which has been a combination of rising ACoS and an increasing share of revenue from PPC. If you have been following our PPC series, you know that Mike and I have been spending a considerable amount of time optimizing our PPC which is slowly paying dividends with ACoS decreasing to 21.7% in May compared to 32.1% in April.
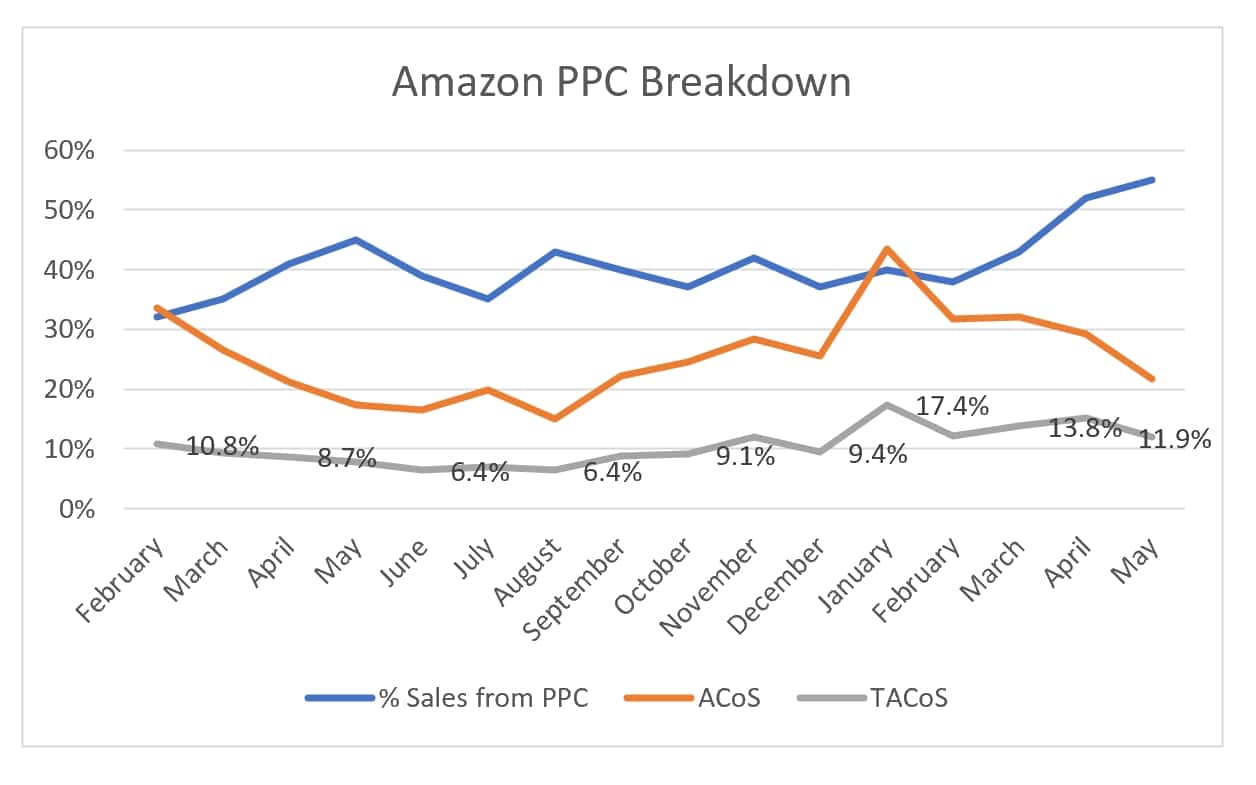
However, TACoS is still HUGE. It was 11.9% in May 2021 compared to 8.7% in May 2020. On $330,000 in revenue, this is over a $10,000 difference in advertising. Here's the blended average amongst my brands and marketplaces:
A big part of the increasing share of PPC is the sheer number of new products I've launched in 2021. I've grown my second brand from basically $10,000 to $100,000 per month in the last year and for my Offroading brand we launched two huge new products this year. My percentage of sales from PPC will likely drop as long as product development slows, but ACoS is likely to remain in the 20% to 30% range indefinitely.
- Cash flow issues. Having a nice cash event from an exit in 2016, combined with some COVID stimulus in 2020, cash flow hasn't been an issue for several years. The massive delays in shipping meant I was often paying for $50,000 to $100,000 shipments two or three months prior to receiving them (compared to four to six weeks normally). This all lead to a point I hadn't faced since starting this brand: I had essentially $0 cash in the bank. This means that by this time next year, even if I get roughly 25% of the profits in the company, it'll only allow for roughly $500,000 revenue growth without additional funding.
Indiegogo campaign was a total flop. I always wanted to try a crowd funding website like Indiegogo, so I tried it out for one of the new vehicle tents we were launching. From everything I've heard, I know the first 24 hours are critical, and you need to send a ton of traffic to your listings. We sent about 100 visitors and $650 in sales which I thought would be enough to get some organic traction. It wasn't. Indiegogo only sent the campaign 100 visitors or so over the campaign life.
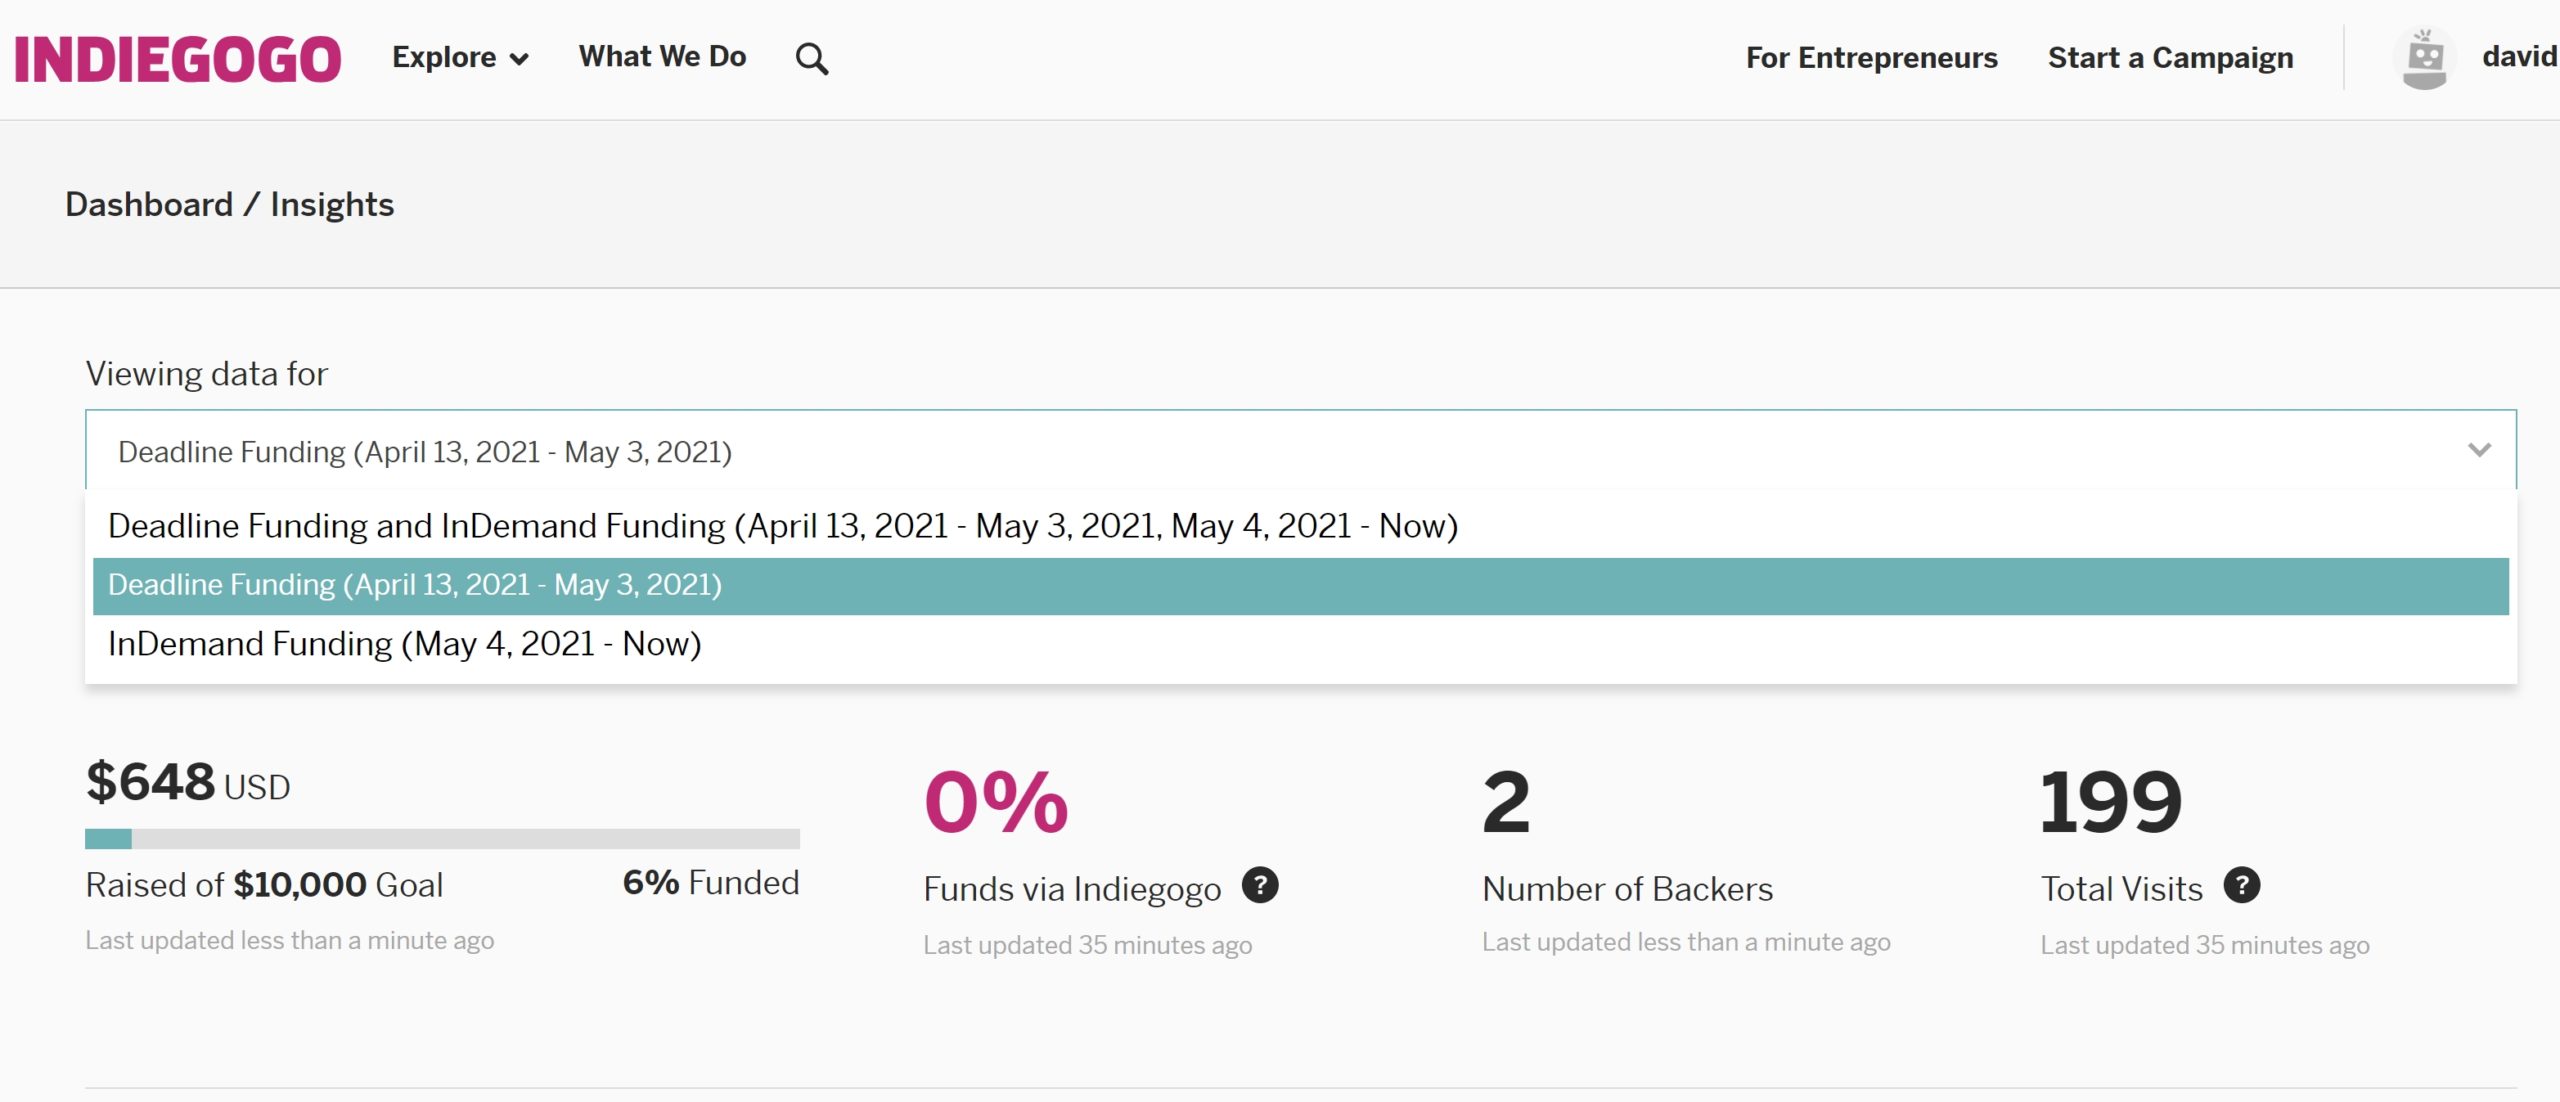
I'm sure I'm to blame for the lack of success for our campaign, but I was still extremely disappointed in the lack of organic traffic that Indiegogo sent the campaign.
- One new product has some design issues. One of the major new products we launched has some design issues. It's a tent, and it basically has some issues in the wind. I think we've managed to rework the design, and it will alleviate these issues. But with the product now sitting at 3.6 stars with a few nasty reviews, it means that we may need to relaunch the product on a new ASIN, which is a total pain. The returns cost on the products will likely end up being a $10,000 financial hit as well. I've been doing this long enough to know to expect these types of things to happen on the first versions of products, and it's one of the reasons I always advocate trying to negotiate as low of MOQ on your first order as possible.
Goals for 2022
- Growth limited to 15% to 25%. Due to the cash flow constraints in 2022, my growth will be severely capped. Growth was 100% in 2020 and it has been 66% in 2021. I expect it will be 15 to 25% in 2022. I've made the mistake in the past of chasing huge growth when cash flow isn't there.
- Increased attention to profitability. I will spend a lot of time for the rest of the year focusing on improving profitability. There's a bunch of reasons for this. The first is the cash flow constraints mentioned above. The next is because revenue is big enough now where squeezing the fruit will result in a decent amount of juice. And last, to leave open the possibility of an exit if I ever decide to go that way, although it's not imminent. Focusing on profitability will mean a few things:
- Killing low revenue/profitability SKUs to simplify the business and free up cash flow
- A/B testing all of our main gallery images using Amazon experiments as well as refreshing all imagery
- Trying to reduce the number of shipments by consolidating more ships into 40′ FCL instead of 20′ FCL
- Eliminating ad campaigns that haven't been profitable for more than six months
Conclusion
It's incredible that this blog post series is already four years long. It also puts in perspective how long EcomCrew has been around (we're going on 7 years now!). This second run at operating an ecommerce business has now surpassed the size of the previous company that I sold in terms of revenue by about 50 percent.
However, profits are just slightly higher. It goes to reflect the overall trend in ecommerce – it's easier than ever to start and run a 7-figure ecommerce brand. However, margins are being continuously pushed down. I suspect this trend will continue for quite some time.
How has your 2021 been so far? Is your revenue up or down from 2020? Let me know in the comments section below.


Hi Dave
Outstanding post. Wow congrats on the growth and great year!
As you know we are launching 2 products as we speak and are definitely learning some tough lessons.
What is your profit margin?
Our first product was 14-15% and it has been really tough to figure out ppc acos with that profit margin.
Our second product is 29% and a much higher price point. Ppc has been more successful and easier to keep under 20%.
One last question. Do you still launch with Vine
for 30 reviews in the beginning of a launch?
We did not and are regretting it because we got 2 “2 star reviews” for issues that actually are not real issues just confusion by tge customer. But it has impacted our score down to 3 stars because we only have 4 total reviews. So we just enrolled in Vine. A bit of a reaction vs being proactive with our reviews.
Dave
Thanks David!
Our margins, before fixed costs, range from 20-25% on average. This is taking everything into account, including inbound freight, 3PL fees, some storage/returns allowance, and a 10% TACoS. Essentially we mark up everything 300-400% from the China FOB cost.
PPC will make or break most products. If you can’t keep your PPC share and ACoS manageable, it’ll sink your products. It’s OK having 50% ACoS if you’re revenue share from PPC is 5%. Not so much if your revenue share from PPC is 75%.
YES! Every product gets launched with Vine – and we’re giving away $100-300 products often. You need to get those first reviews, and first reviews with relatively certaintity of them being positive otherwise you run into the scenarios like you described.
Hi Dave
Did I see your strategy with a new product is….the first shipment is going to loose money, the second shipment you look to break even, the third shipment you try to make profitable?
Also, what strategies do you use to give away product?
Dave
Yes, this is more or less right.
The rebate clubs don’t work with us (the items are too niche), so we reach out to influencers directly (mostly through YouTube). The biggest goal with this is to get some user generated content about the products – any traffic they send from their audience is a bonus.
Hi Dave
Thank you for the great reply and info.
Here is a summary of our issue.
Cost of product to get into FBA $13
Selling price $36
Net profit $8.76 (25%)
Average CPC on Amazon for category .80 cents.
Conversion rate of our product 10%
So we spend on average (if we were at the average cpc of .80)
Average spend for each sale $8
Acos of 90 plus percent!
Dave actually our average cpc for this product has been $2.92 per click. Making our acos 300 plus percent.
I thought to win a bid its $1 over nearest bid.
Based on the above I do not see even at .80 cpc and a 10 percent conversion we will ever get close to 20 percent acos.
What are we missing or what solution would you suggest?
Aways grateful for your advice.
Dave
Hi David,
It’s near impossible to get a 20% ACoS in most categories (and I know your category and it’ll be especially tough in that).
I’d start by trying to get to sub 50% first, and ideally 40%.
The path forward for that is : 1) Increase conversion rate to 20%+ and 2) Increase the price of your products. A 10% conversion rate is pretty bad at your price point and also with your product. Your conversion rate is bad likely because you have a lack of reviews (and or good reviews) and your messaging could likely use some tweaking. The reviews will come over time – once you get past 100 you’ll see some big conversion increases. Also, if you can get your price point closer to $39.99 or even $42.99 this will drop your ACoS.
And then, ultimately you’ll need to wean yourself from PPC. A reasonable target by the end of the year is 35% ACoS with 35% Revenue from PPC, which would give you a 12% TACoS, which you should be able to be profitable with.
OMG thanks you Dave for sharing. I warms my heart to read such transparency! It helps me so much!
Glad to hear you enjoyed it!