Amazon Q2 2026 Earnings: 26% Ad Growth Squeezes Sellers

Amazon reported $200.6 billion in net sales for the second quarter of 2026, up 20% from $167.7 billion a year earlier.
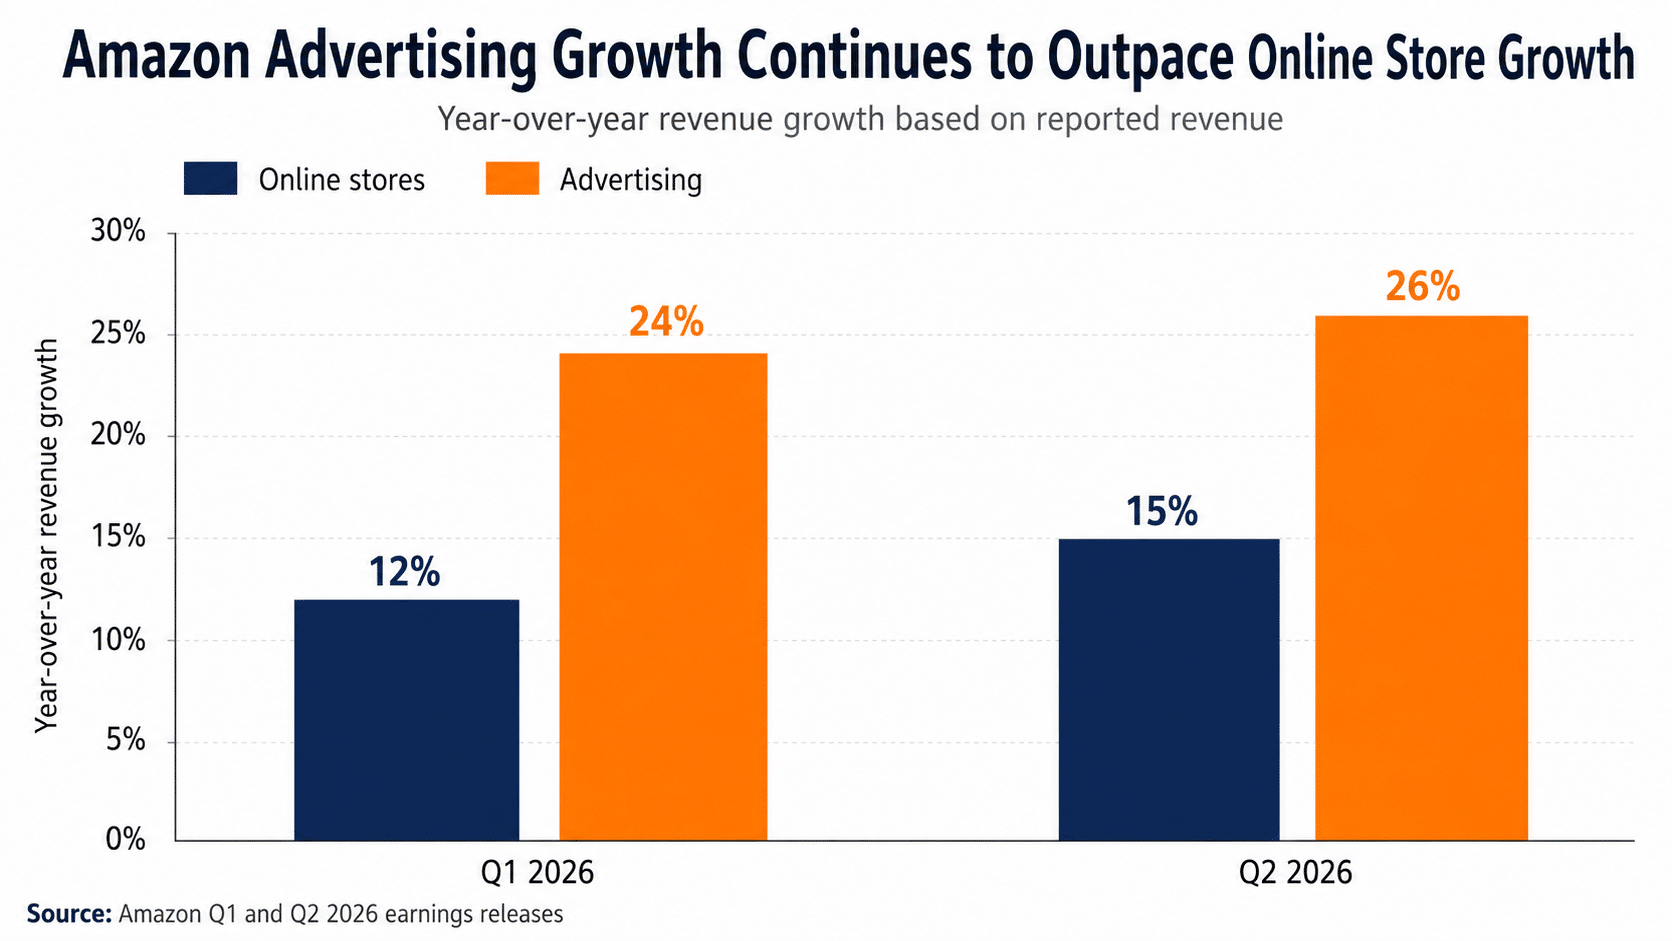
Online store revenue grew 15%, third-party seller services grew 16%, and worldwide paid units increased 17%. Advertising revenue grew 26%, nearly twice the rate of online store revenue.
Retail growth accelerated from the figures reported in Amazon’s Q1 2026 earnings, but advertising continued to outpace the marketplace.
Amazon Advertising Revenue Grew 26%
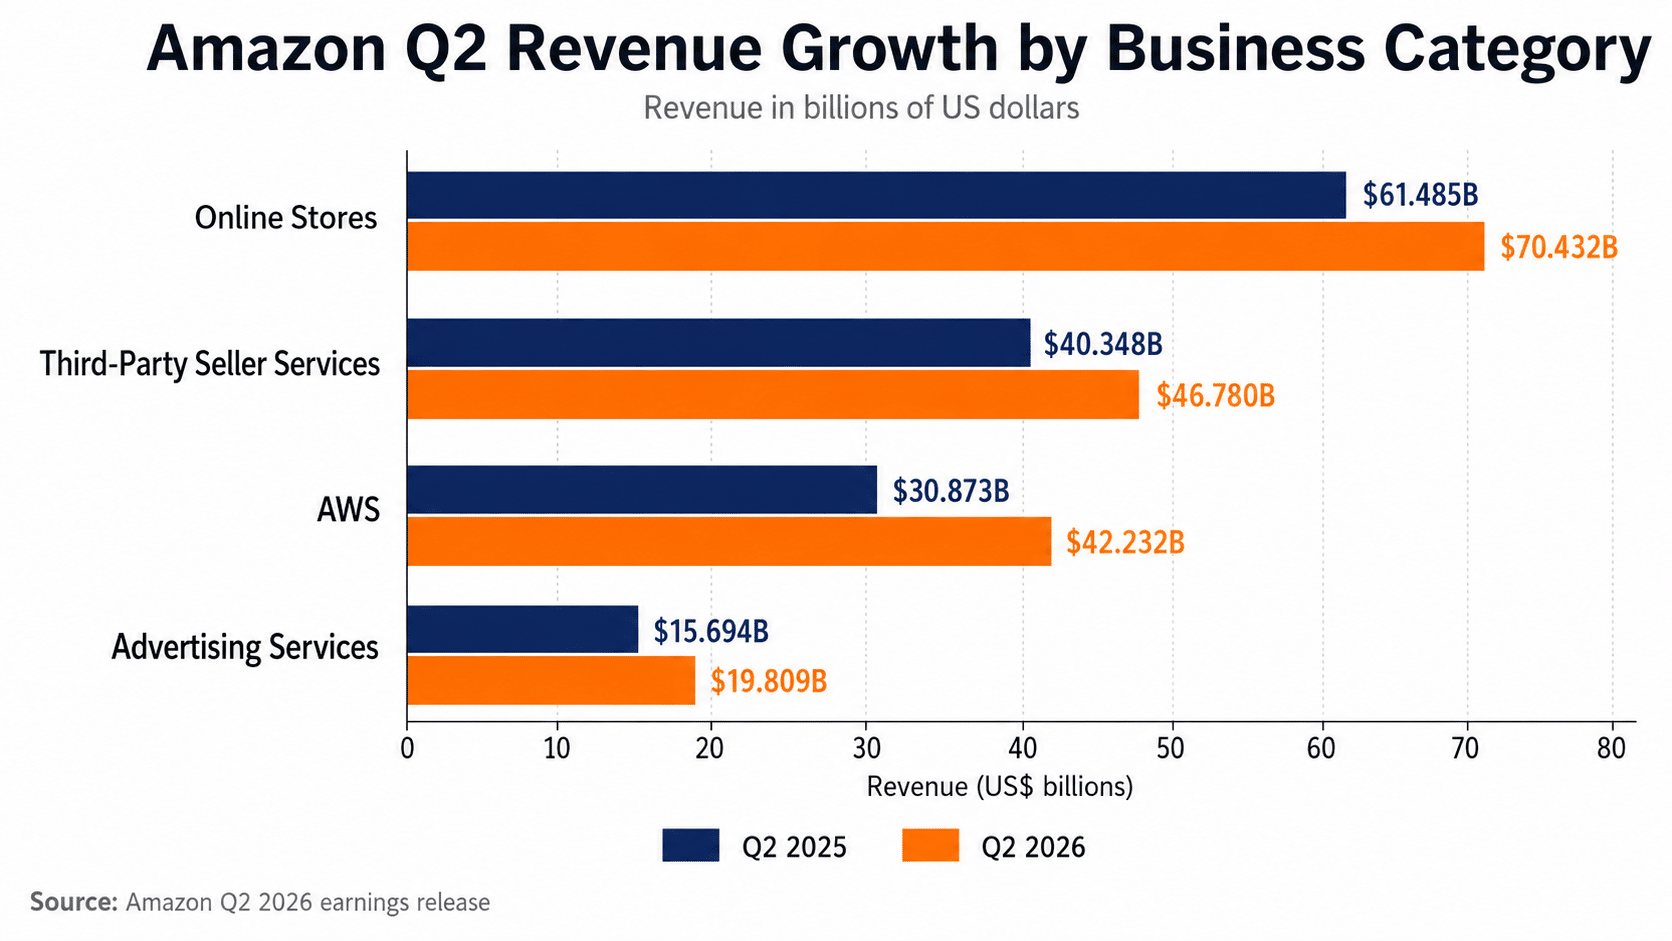
Amazon’s advertising revenue increased from $15.7 billion in Q2 2025 to $19.8 billion in Q2 2026. Online store revenue increased from $61.5 billion to $70.4 billion over the same period, according to Amazon’s official Q2 earnings release.
Online store revenue includes products sold directly by Amazon. It does not include the full value of products sold by third-party merchants. Amazon does not disclose total marketplace gross merchandise value.
Advertising grew about 1.7 times faster than online stores during the quarter.
In Q1, advertising revenue increased 24% while online store revenue grew 12%. In Q2, those rates accelerated to 26% and 15%, respectively.
Worldwide paid units increased 17% in Q2. Advertising revenue grew 26%, which works out to approximately 8% more advertising revenue per paid unit than a year earlier.
This calculation does not represent a direct 8% increase in seller advertising costs. Amazon’s advertising category includes Sponsored Products, display advertising, video placements, Prime Video ads, and other services.
Sponsored Products remained Amazon’s largest advertising product and a major source of growth. Amazon also expanded Ads Agent to 11 additional countries. Advertisers using its targeting tools recorded 8% lower cost per impression and 6% lower cost per acquisition, according to Amazon.
Sellers can compare campaign structures and targeting options in EcomCrew’s guide to Amazon PPC advertising.
Third-Party Seller Services Revenue Increased 16%
Third-party seller services revenue increased from $40.3 billion in Q2 2025 to $46.8 billion in Q2 2026.
This category includes referral commissions, fulfillment and shipping fees, and other services charged to third-party sellers. EcomCrew’s guide to Amazon seller fees provides a breakdown of the main charges sellers pay.
Worldwide paid units grew 17%, while third-party sellers accounted for 61% of those units. Third-party sellers represented 62% of paid units in Q2 2025.
Based on those figures, third-party unit volume grew by approximately 15%. Amazon does not disclose the exact number of units sold by third-party merchants, so this figure is an estimate.
Third-party seller services revenue grew 16%, only slightly faster than estimated third-party unit volume. Revenue collected per third-party unit therefore increased by roughly 1%.
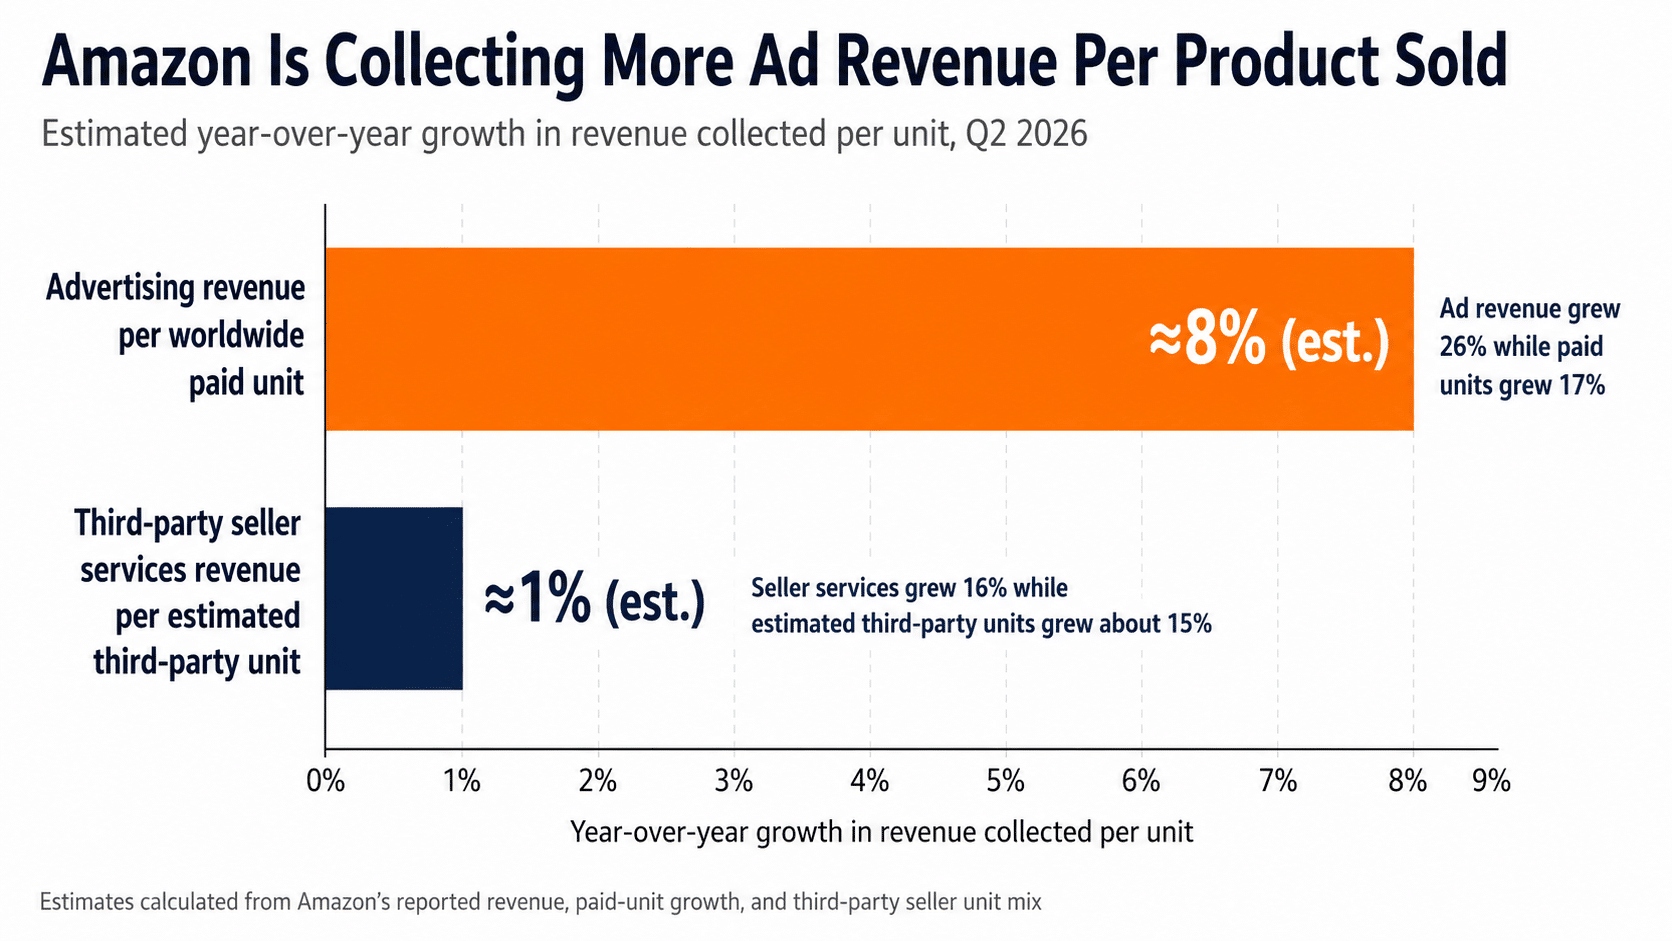
Most of the increase in seller services revenue came from higher sales volume rather than a large increase in revenue collected from each unit.
Amazon’s worldwide shipping costs rose 19%, from $23.4 billion to $27.9 billion. Fulfillment expenses increased from $26 billion to $29.6 billion.
Sellers can compare shipment options and fee structures using EcomCrew’s guide to reducing Amazon inbound placement and shipping fees.
Prime Day Helped Move Sales Into Q2
Amazon expects Q3 2026 net sales to reach between $197 billion and $202 billion, representing year-over-year growth of 9% to 12%.
The company said Q3 growth would be nearly four percentage points higher if Prime Day were excluded from both the 2025 and 2026 comparisons.
Part of the expected slowdown comes from Prime Day sales moving from Q3 into Q2.
Online store growth increased from 12% in Q1 to 15% in Q2. Worldwide paid-unit growth also rose from 15% to 17%.
The shift in timing will make the Q3 comparison look weaker even if the underlying level of marketplace demand remains similar.
Amazon’s Overall Q2 2026 Results
Amazon’s operating income increased 43%, from $19.2 billion to $27.5 billion. Its operating margin rose from 11.4% to 13.7%.
AWS recorded $42.2 billion in revenue, up 37% from $30.9 billion. It was the segment’s fastest growth rate in 18 quarters. AWS operating income increased 64% to $16.6 billion.
Amazon reported $62.6 billion in net income, compared with $18.2 billion in Q2 2025. The result included $53.4 billion in non-operating income, primarily related to Amazon’s investment in Anthropic.
Operating income provides a cleaner comparison of Amazon’s underlying business performance because the Anthropic gain was not generated by normal operations.
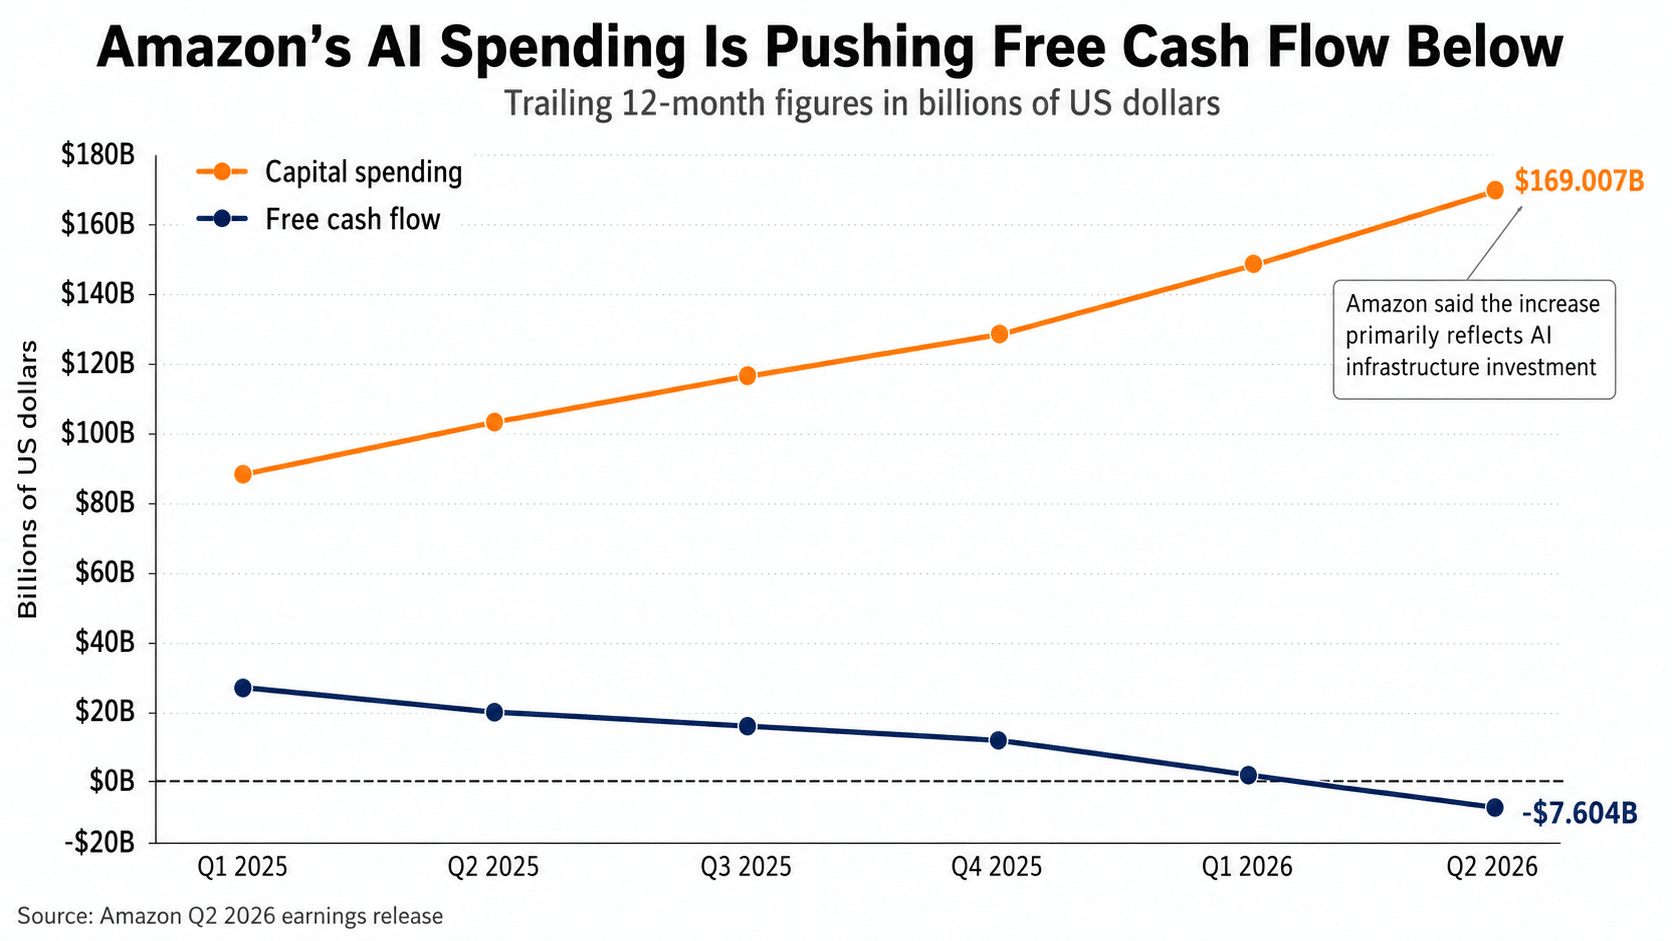
Amazon’s trailing 12-month operating cash flow increased 33% to $161.4 billion.
Free cash flow moved in the opposite direction, falling from an $18.2 billion inflow to a $7.6 billion outflow. Purchases of property and equipment, net of proceeds and incentives, rose 64% to $169 billion.
Amazon attributed the increase primarily to investments in artificial intelligence infrastructure
Amazon Seller Costs in Q2 2026
Marketplace demand remained strong during the quarter. Worldwide paid units grew 17%, online store revenue increased 15%, and third-party seller services rose 16%.
Seller services revenue largely tracked estimated third-party unit growth. Amazon collected only slightly more seller services revenue per unit than it did a year earlier.
Advertising followed a different pattern. Revenue increased 26%, outpacing online stores, paid units, and seller services.
Amazon generated approximately 8% more advertising revenue per paid unit, while seller services revenue per estimated third-party unit increased by roughly 1%.
Higher sales volume supported marketplace growth in Q2. A growing share of the competition for that volume continued to run through Amazon’s advertising system.