Amazon Q3 2026 Earnings: Record Margins, Mixed Signals for Sellers

Amazon’s Q3 2026 earnings report showed $201.9 billion in revenue for Q3 2026, up 12%, and its highest operating margin ever. AWS grew 39%, giving investors plenty to celebrate.
For ecommerce sellers, the picture takes more unpacking. Online-store revenue grew just 2%, while paid units increased 12%. Advertising brought in $19.6 billion, and Amazon continued pushing faster delivery and AI tools into shopping, advertising, and seller operations.
There’s also a calendar problem: Prime Day moved into Q2 in most large countries. Comparing this quarter directly with last year can make demand look weaker than it actually is.
Amazon’s Record Profits Need Some Context
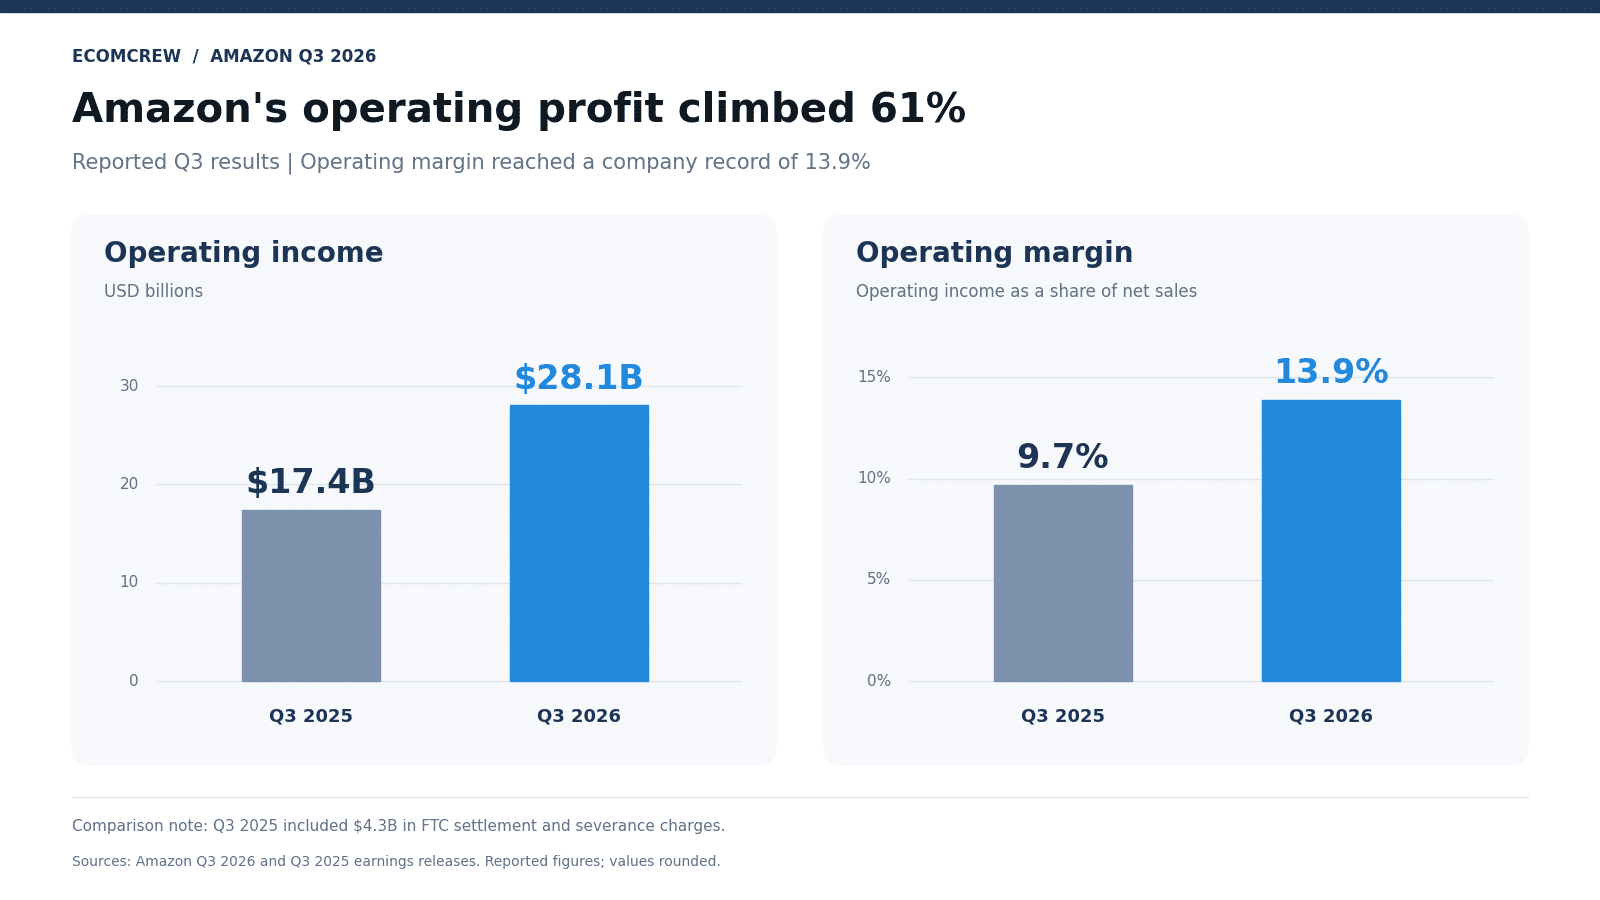
Operating income reached $28.1 billion, up 61%, with a 13.9% margin. North America’s margin increased from 4.5% to 7.7%, while International improved from 2.9% to 3.7%.
Those regional segments include advertising and seller services alongside retail. Their margins don’t tell us how profitable selling physical products alone has become.
Last year also provides an unusually easy comparison. Amazon’s Q3 2025 results included a $2.5 billion FTC settlement charge and $1.8 billion in severance charges. Against Amazon’s disclosed $21.7 billion operating income excluding those charges, this quarter’s increase is about 29%.
AWS generated $17.8 billion, roughly 63% of total operating income. That helps explain why Amazon’s corporate results can look spectacular without every seller experiencing a great quarter.
Net income actually fell 2% to $20.7 billion, largely because last year included $9.5 billion in Anthropic investment gains.
Prime Day Distorts Retail Growth and Seller Comparisons
Online-store revenue reached $68.5 billion, up 2%. That category mainly records Amazon’s own product and digital-content sales; it does not include third-party sellers’ full merchandise sales.
North American revenue grew 6% to $112.9 billion. International grew 5% to $43.1 billion, or 8% excluding currency movements.
Amazon estimates the Prime Day shift reduced companywide year-over-year revenue growth by approximately four percentage points. It doesn’t provide equivalent adjustments for individual revenue categories, so adding four points to online-store or seller-services growth would be guesswork.
For your own business, compare equivalent promotional periods and look at Q2 and Q3 together before concluding that demand fell.
Third-Party Sellers Still Account for Most Units
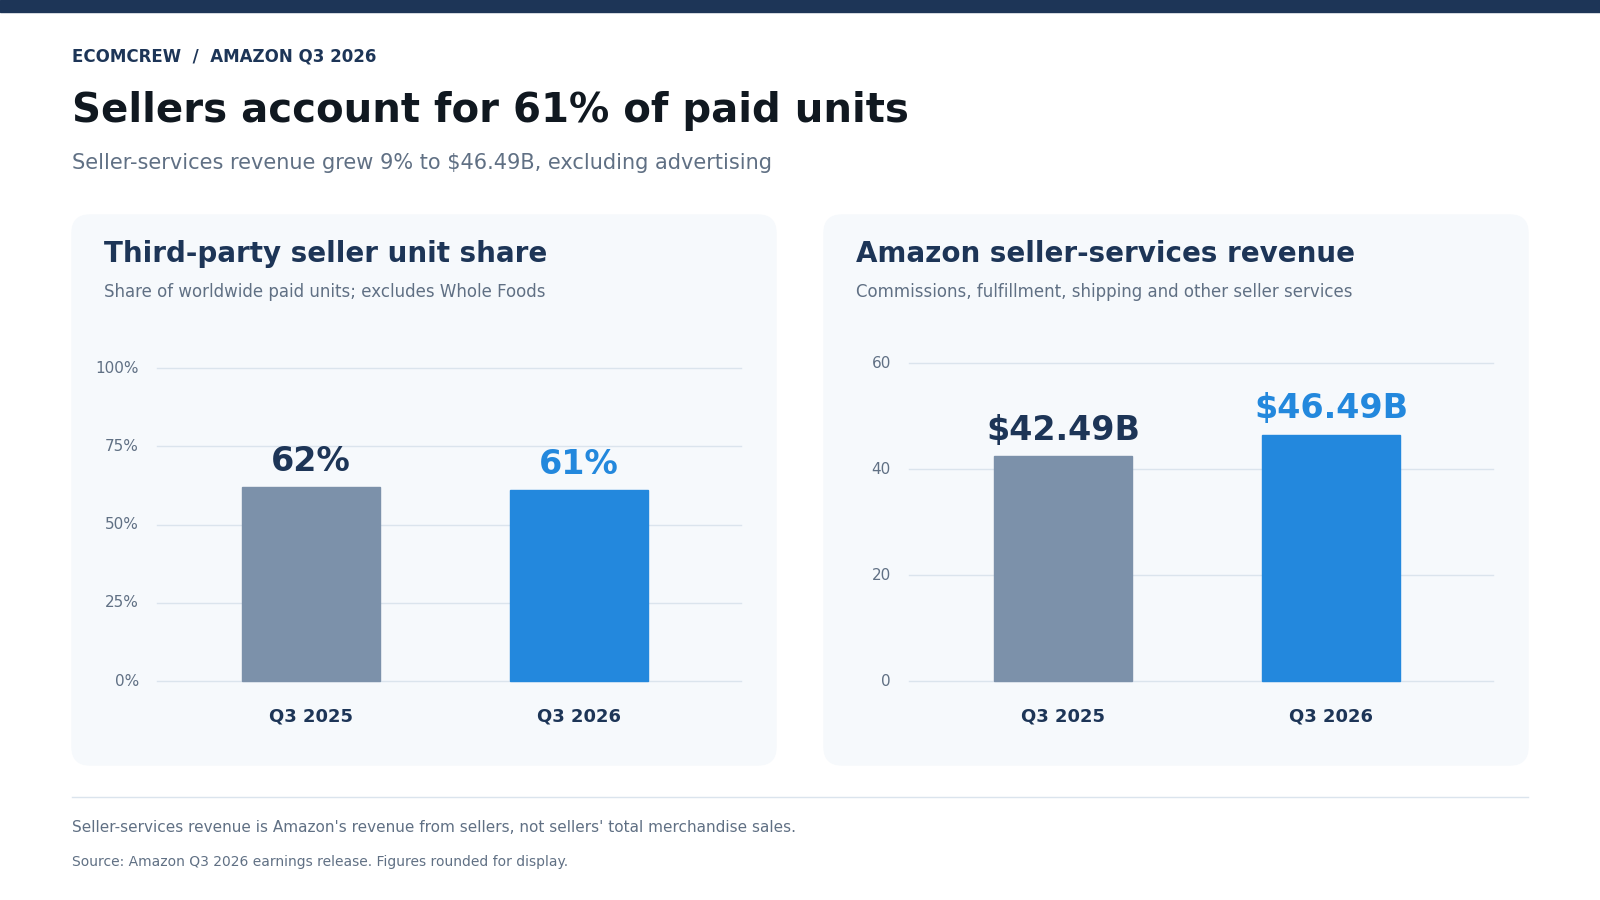
Third-party sellers supplied 61% of paid units, down from 62% a year earlier. Total paid units increased 12%. Using those rounded figures implies third-party unit growth of roughly 10%, despite the smaller share. These metrics exclude Whole Foods.
Seller-services revenue reached $46.5 billion, up 9%, or 10% excluding currency changes. This includes commissions, fulfillment, shipping, and other seller services. Advertising is reported separately.
That revenue increase doesn’t establish that Amazon raised its effective fee rate. More orders and changes in fulfillment usage or product mix can also increase the total.
The useful comparison is your own cost per order. Track referral, fulfillment, storage, inbound, and advertising costs against contribution profit. Amazon’s fee revenue tells you what Amazon collected; your accounts tell you what you kept.
Amazon Advertising Slowed, but Q4 Could Accelerate
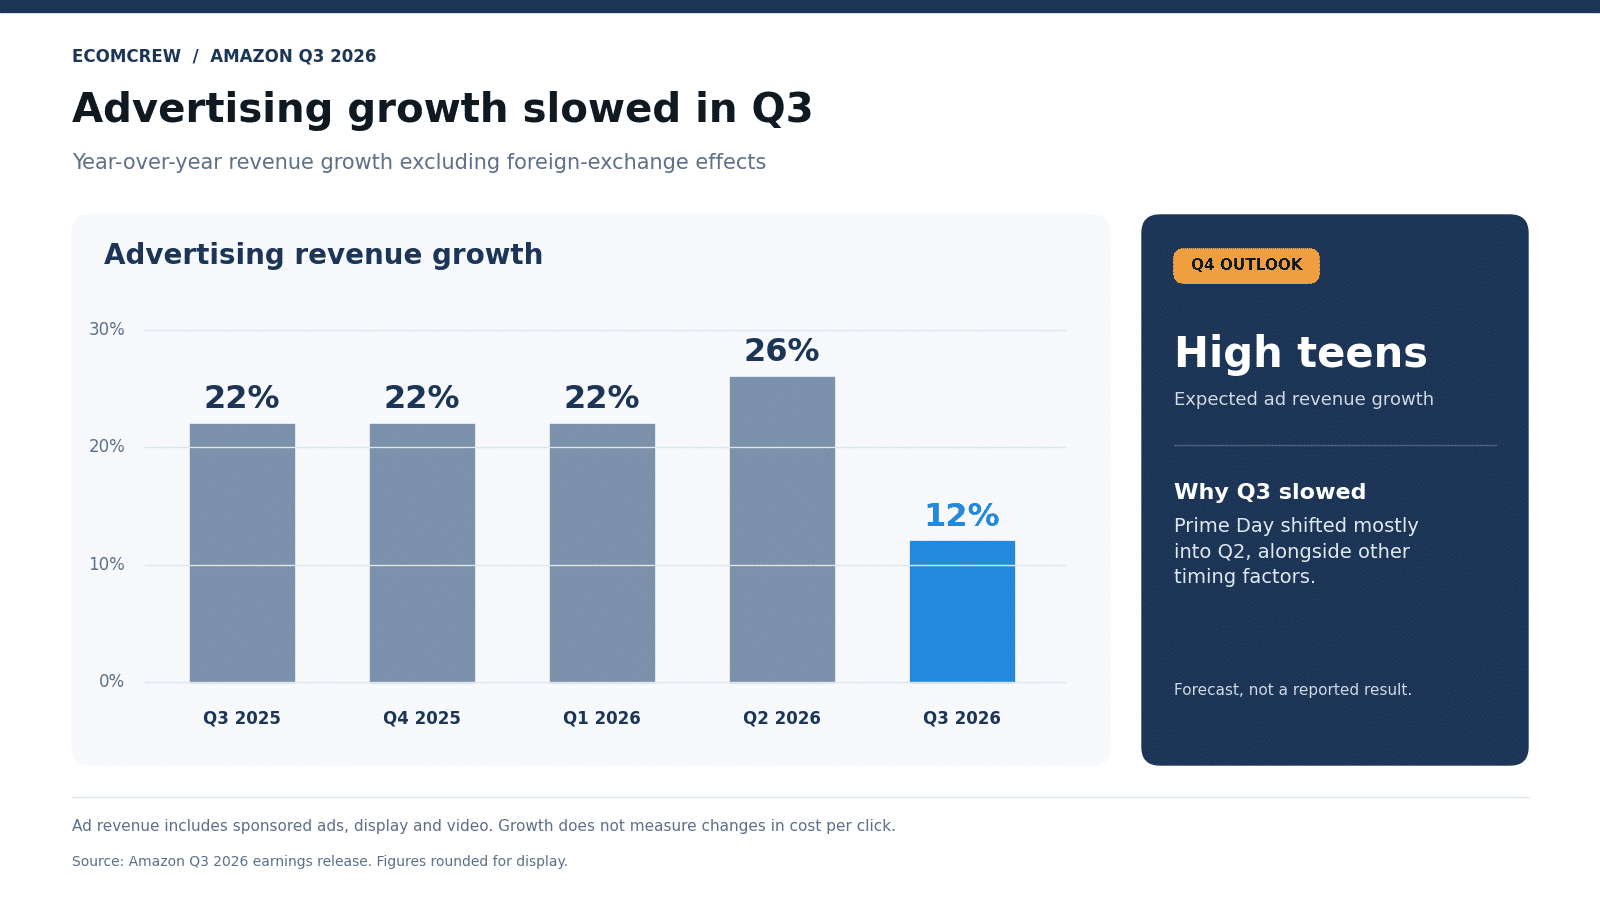
Advertising revenue grew 11% to $19.6 billion, or 12% excluding currency changes. That compares with 26% currency-adjusted growth in Q2.
Amazon attributes the slowdown primarily to Prime Day timing and other timing factors. It expects advertising growth to return to the high teens in Q4.
Sellers shouldn’t read slower advertising revenue growth as evidence that clicks became cheaper. Amazon doesn’t disclose average Sponsored Products CPCs here, and the advertising total includes display, video, and other formats.
Its media audience is also expanding. Thursday Night Football averaged 17.7 million viewers through six games, according to the release. Growth across these audiences makes companywide ad revenue a poor substitute for measuring competition in your particular search results.
AI Campaigns Need a Profit Target
Amazon introduced Ads Agent and launched Full-Funnel Campaigns for U.S. advertisers. These combine sponsored ads, display, video, and streaming TV in one campaign, with AI handling planning and ongoing optimization.
That could reduce setup work. It also means testing several types of advertising whose contribution to sales can be harder to separate.
Before testing, establish a budget ceiling and a contribution-margin target. Compare new-to-brand sales, total advertising cost of sales, and total business profit against your existing campaigns.
A better reported return on ad spend is useful only if it reflects additional profitable demand. Check whether the campaign is finding new customers or claiming credit for purchases you would likely have received anyway.
Groceries and Faster Delivery Are Changing Amazon’s Sales Mix
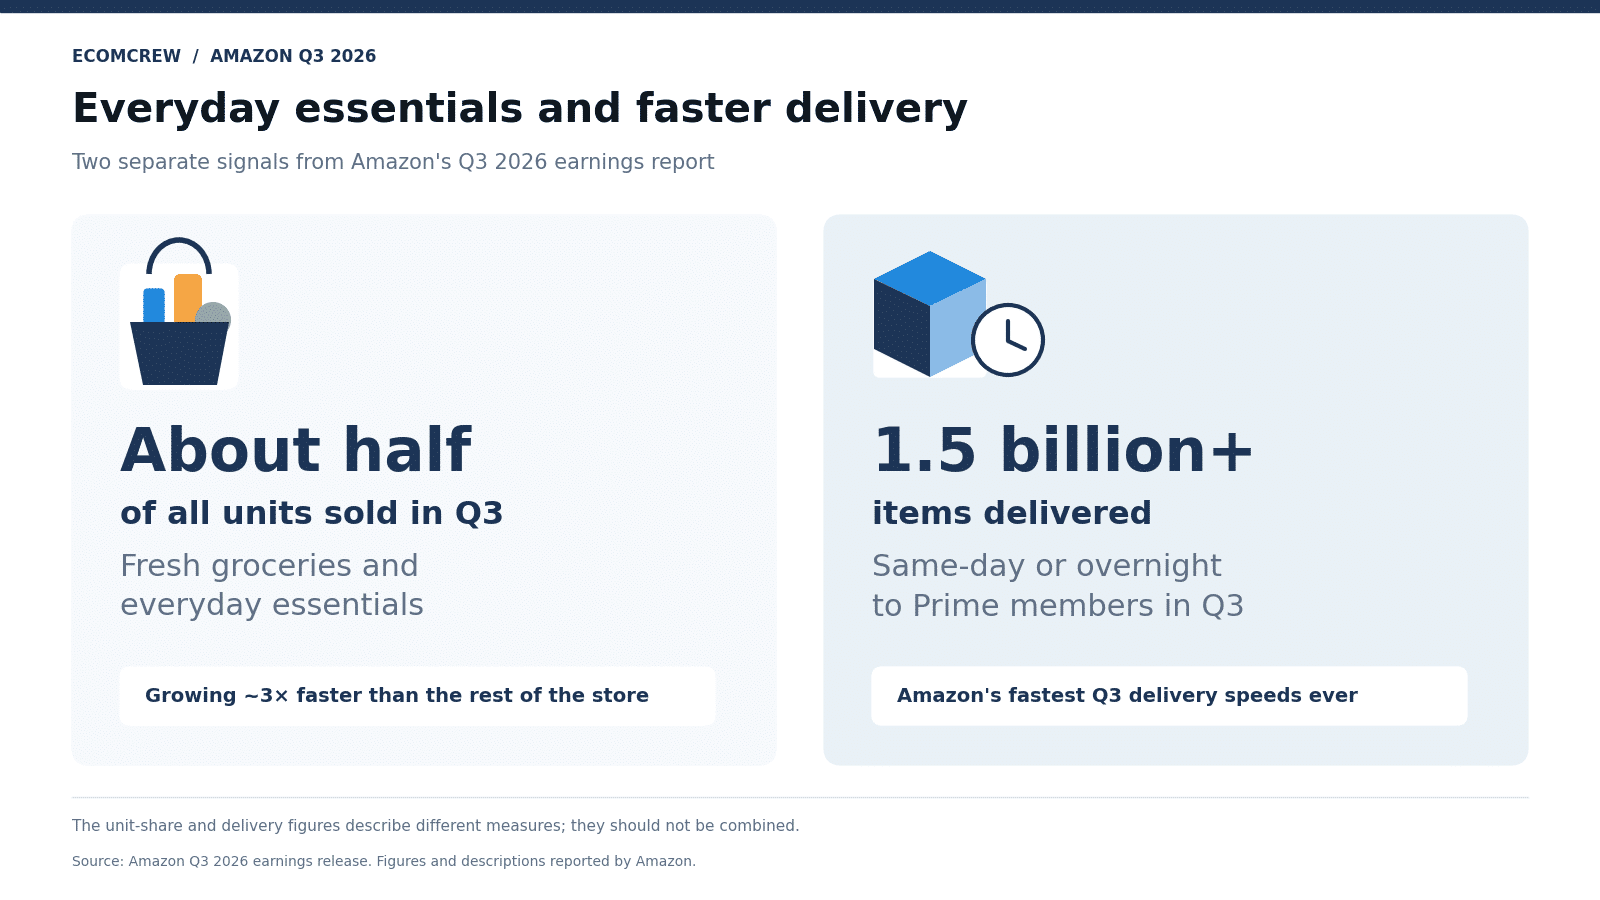
Amazon says fresh groceries and everyday essentials grew about three times faster than the rest of its store and represented roughly half of units sold in Q3.
That helps explain why strong unit growth can coexist with modest online-store revenue growth. However, the different reporting scopes mean these figures cannot establish an exact change in average selling prices.
For brands selling discretionary products, Amazon’s overall volume growth may overstate what’s happening in your category. Someone buying more household supplies isn’t necessarily buying more camping equipment or kitchen gadgets.
Amazon also reported more than 20% growth in selection from notable brands including Banana Republic, La-Z-Boy, and The Farmer’s Dog. More recognizable brands mean you should revisit competing offers when reviewing conversion declines.
Delivery Promises Deserve an Inventory Check
More than 1.5 billion items reached Prime members the same day or overnight during Q3. Amazon Now expanded to over 450 towns and cities worldwide, with items ordered up tenfold year over year.
Subscription revenue rose 11% to $14 billion, although that includes digital subscriptions and doesn’t reveal Prime membership growth.
These delivery figures signal rising expectations for delivery speed. They don’t establish that every third-party product qualifies for those services.
Check delivery promises on your best sellers across several customer locations. Prioritize keeping proven products available, then compare the margin after fulfillment, inbound, and storage costs.
Sending more inventory into FBA only helps if it improves availability enough to justify the expense. Slow-moving stock can still lose money in a faster network.
AI Shopping Makes Accurate Product Information More Important
Amazon says more than 400 million customers used Alexa for Shopping over the past year, with interactions increasing 570%. It added over 100 capabilities, including gift lists and changes to Subscribe & Save deliveries.
These are usage figures. Amazon doesn’t disclose how much merchandise revenue those interactions generated or how often recommendations converted into purchases.
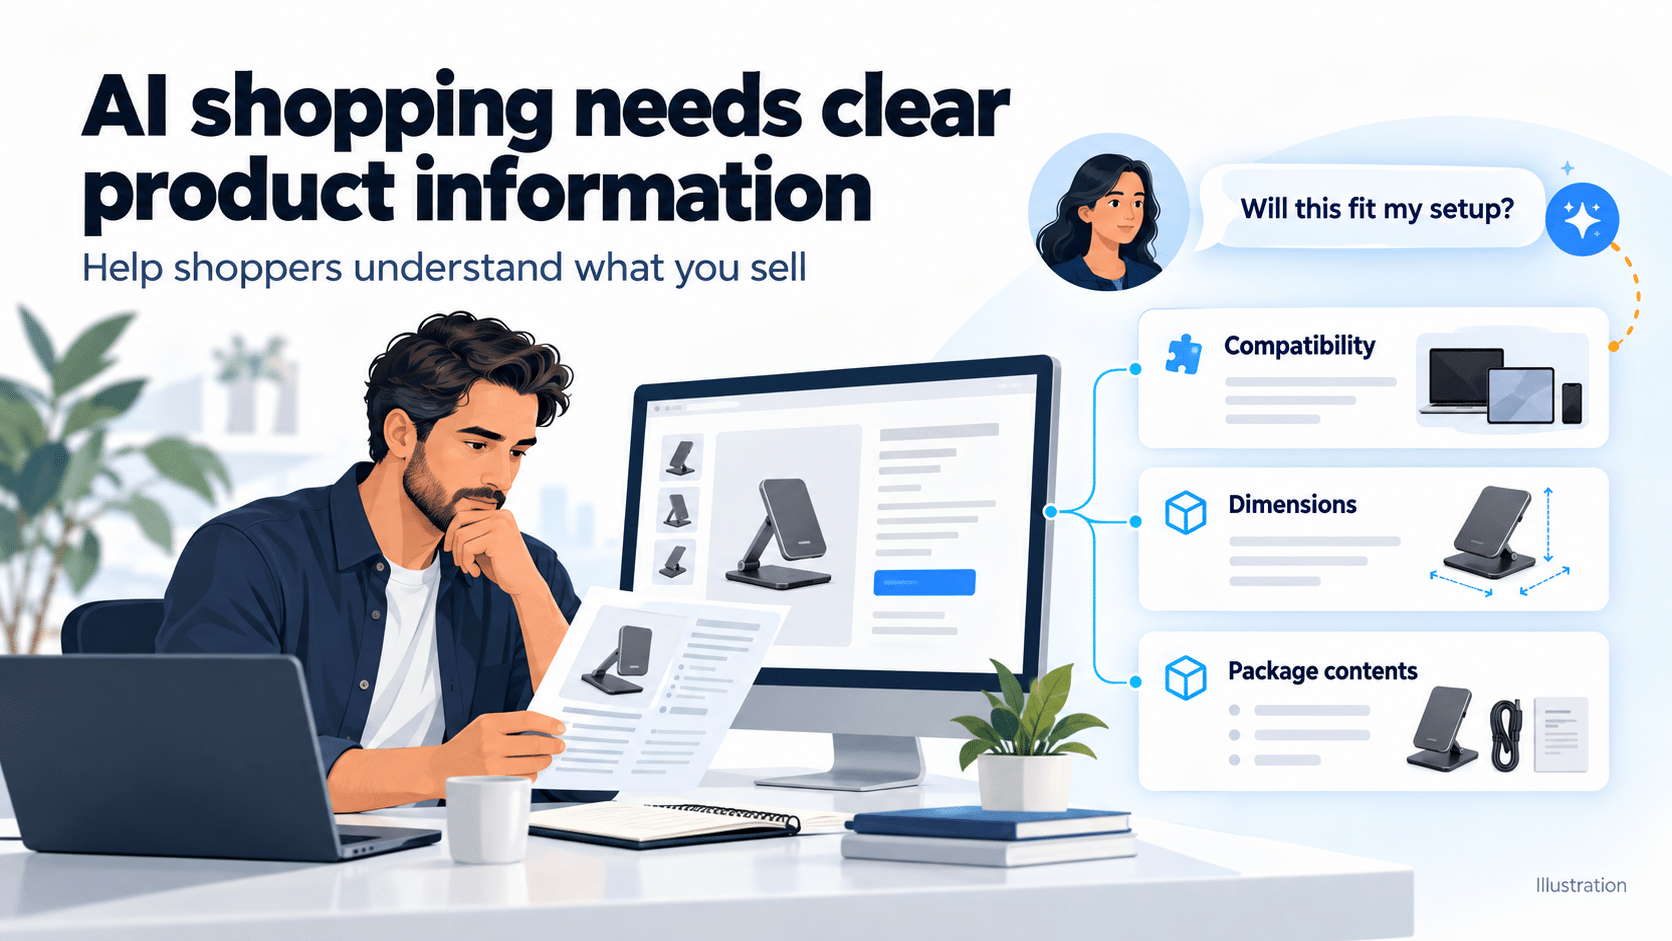
Still, the practical preparation for brands is straightforward: make product information easy to interpret. Check dimensions, compatibility, materials, included accessories, and intended uses across titles, attributes, descriptions, and images.
If shoppers ask whether an accessory fits their particular model, vague copy gives them little to work with. Clear information supports purchase decisions even when Amazon doesn’t reveal how its shopping assistant selects products.
Seller Assistant Expands Into Daily Operations
Amazon also highlighted Seller Assistant workflows for restocking and pricing, integrations with Amazon Quick and Anthropic’s Claude, and tools to manage listings, orders, and profitability across multiple channels from Seller Central.
The appeal is less time switching between systems. The risk is letting automation act on incomplete costs or outdated inventory information.
Start with a small product group. Set minimum profitable prices, spending or purchasing limits where available, and a review process for changes. Confirm which features are available in your account.
Cross-channel reporting can help, but reconcile it with your own records before using it to decide which products deserve more inventory.
Amazon’s AI Spending and Q4 Outlook: What Sellers Should Plan For
Amazon generated $168.3 billion in operating cash flow over the trailing 12 months, up 29%. Yet free cash flow fell to negative $42.4 billion because capital spending climbed sharply, primarily for AI. Amazon still expects approximately $220 billion in cash capital expenditures for 2026.
That explains how record operating profits and negative free cash flow can coexist. The release gives no basis for treating that spending as an announcement of future seller fee increases.
For Q4, Amazon forecasts revenue of $240 billion to $247 billion, representing 12%–16% growth, and operating income of $28.5 billion to $33.5 billion. Those are companywide forecasts, including AWS.
Amazon also plans to hire more than 300,000 U.S. seasonal, part-time, and full-time employees for the holidays. That signals preparation for volume, but it doesn’t guarantee timely receiving for your particular shipments.
Build your holiday plan around the numbers you control:
- Inventory: Forecast by ASIN using recent demand, event timing, and realistic replenishment lead times.
- Advertising: Budget for individual campaigns using current conversion rates and contribution margins.
- Pricing: Recalculate promotional profitability after discounts, advertising, fulfillment, and expected returns.
- Cash: Allow for inventory payments, slower sell-through, and post-holiday returns.
Q3 shows that Amazon is selling more units and earning substantially more operating profit. Your holiday plan should show how additional sales will improve your own cash and profit before you commit to the inventory.